Methodology for EIA Weekly Underground Natural Gas Storage Estimates
Latest Update: September 10, 2018
This report consists of the following sections:
- Survey Operations and Survey Processing—description of the survey and an overview of the program
- Sampling—description of the selection process EIA uses to identify companies in the survey
- Estimation—description of how EIA prepares the published estimates from the collected data
- Computing Estimated Measures of Sampling Variability for Published Estimates of Weekly Working Gas Storage Levels and Weekly Net Changes and Using Estimated Measures of Sampling Variability to Compute Confidence Intervals—descriptions of the method EIA uses to compute published standard errors and coefficients of variation and how EIA may use them with the corresponding point estimates to compute confidence intervals for levels and net changes
- Computing the Five-Year Averages, Maxima, Minima, and Year-Ago Values for the Weekly Natural Gas Storage Report—description of the method EIA uses to prepare weekly data to compute the five-year averages, maxima, minima, and year-ago values for the weekly report
- Derivation of the Weekly Historical Estimates Database (1993-2002)—description of the process EIA uses to generate the historical database for the period before weekly data collection
- Derivation of the Weekly Historical Estimates Database (2010-2015)—description of the process used to generate weekly regional estimates for five geographic regions before EIA collected data for five regions
- Base Gas Withdrawals—overview of the procedure to handle information on withdrawals from base gas that occurred during the winter of 2002–2003, which was similar to the procedure used to handle information on withdrawals from base gas during the spring of 2018
Introduction
The U.S. Energy Information Administration (EIA) provides weekly estimates of working natural gas volumes held at underground storage facilities in the Lower 48 states and in five regions. The American Gas Association (AGA) first provided weekly estimates of working gas in storage in 1994. In October 2001, the AGA announced that it would discontinue its survey because of resource considerations. AGA's last report was published on May 1, 2002, and provided data for the report week ending April 26, 2002. The EIA first released its estimates of underground storage for the week ending May 3, 2002, on May 9, 2002, in the Weekly Natural Gas Storage Report (WNGSR). EIA posts the WNGSR on its website https://ir.eia.gov/ngs/ngs.html at 10:30 a.m. each Thursday, except for certain weeks that include federal holidays.
This report describes the methodology that EIA has used to prepare weekly estimates of working gas in storage starting in August 2005. The first estimates from the revised methodology appeared in the August 4, 2005 edition of the WNGSR and included stock estimates as of July 29. The overall approach relies on weekly survey data from a sample of operators of underground storage facilities. These data are used to prepare regional and national estimates for all underground storage. Beginning with the report released November 19, 2015, the WNGSR includes estimates of total working gas inventories for the five geographical regions and for the Lower 48 states. Before this date, the WNGSR published estimates of working gas inventories in three regions and the Lower 48 states total. From January 1, 2010 through June 12, 2015, EIA derived regional estimates for the five regions from data originally published for three regions.
When implementing the 2018 sample for the WNGSR, EIA did not change the established sampling or estimation methodologies for computing the weekly estimates of working natural gas stocks or for computing the net change in working natural gas stocks. However, EIA updated this report on September 10, 2018 to provide more detailed information on three new features included with the implementation of the 2018 sample:
- Data collection from the South Central region operators explicitly separates salt and nonsalt volumes in the survey submissions.
- All eight operators in the Pacific region are surveyed each week, increasing coverage in that region to 100%.
- EIA performs independent rounding for all published weekly estimates of working gas stocks. Previously, EIA derived weekly estimates of working gas stocks for the Lower 48 states by summing the corresponding weekly estimates by region.
Survey Operations and Survey Processing
The goal of the weekly storage data program is to provide weekly estimates of the level of working gas in underground storage for the Lower 48 states and the five regions. The total volume of natural gas in underground storage reservoirs is classified as either base gas or working gas (see Notes and Definitions for definition of terms). Underground storage facilities may be reservoirs in depleted oil and natural gas fields, aquifers, or salt caverns (a more detailed discussion of underground storage concepts is available in the EIA report, The Basics of Underground Natural Gas Storage).
EIA designed Form EIA-912, Weekly Underground Natural Gas Storage Report, to collect weekly survey data on working gas in storage (Exhibit 1 and Exhibit 2). The Form EIA-912 requests information on the volumes of working gas in storage as of 9:00 a.m. Central Standard Time (CST) Friday of the previous week from a sample of underground natural gas storage operators. Respondents are asked to provide data on working gas in storage fields that their company operates in each of five regions of the United States.
The most recent version of the Form EIA-912, approved by the U.S. Office of Management and Budget in late 2017, requires storage operators in the South Central region to report the volumes of working gas held in salt facilities and nonsalt facilities separately. Previously, for respondents operating both salt and nonsalt fields in the South Central region, EIA internally classified the entire inventory reported based on the count of the field type for the operator. By February 2018, all survey respondents to the Form EIA-912 had transitioned to the revised version of the form. Although this change only affects the data reported by a few respondents, it allows EIA to more accurately distinguish storage between salt and nonsalt fields. This increased accuracy leads to slightly lower measurement error in the weekly working gas estimates for South Central Salt and South Central Nonsalt fields, as well as weekly working gas estimates for the South Central region. The change in data collection was implemented with the 2018 sample and is first reflected in revised estimates published on September 10, 2018, when estimates from the 2018 sample were phased in over the eight-week period from July 13 to August 31, 2018. The first report reflecting this change is for the week ending September 7, 2018, published on September 13, 2018.
Respondents are also instructed to submit revisions to data for previous weeks if those revisions were greater than 500 million cubic feet and to include notes explaining any unusual activity. Examples of unusual activity might include any inventory adjustments or changes in ownership or operation of storage fields. In practice, respondents often do not need to provide notes on unusual activity. In 2015, Form EIA-912 was revised to include a section for respondents to report the quantity of any non-flow related activity affecting working gas inventory levels by region.
EIA has provided copies of the survey to all respondents and has also provided electronic versions of the form on our website that respondents can access as an Excel spreadsheet or a PDF file. To provide more timely data, companies are required to report electronically.
Respondents provide estimates for working gas in storage as of 9:00 a.m. Friday each week. The deadline for submitting reports to EIA is 5:00 p.m. Eastern Time the following Monday, except when Monday is a federal holiday. In that case, forms are due at 5:00 p.m. on Tuesday. EIA releases the estimates on Thursday at 10:30 a.m. (Eastern Time) on EIA's website, except for certain weeks that include federal holidays. EIA notes changes to this general schedule on the EIA website at https://ir.eia.gov/ngs/schedule.html, which also is directly accessible using the hyperlink titled Release Schedule located on the right side of the WNGSR webpage.
EIA uses several editing processes to ensure that the data collected each week are accurate. For example, the current week's data are compared with data reports for recent and relevant historical weeks and to compilations of the monthly data reports for the company's fields on the EIA monthly storage form. EIA also uses secondary-source information such as weather data, pipeline flows, and third-party stock or net change estimates. Companies with responses that are outside the edit bounds or with notes about special issues are contacted by survey personnel for confirmation or correction.
EIA draws a sample for the EIA-912 from the census of storage operators that report on Form EIA-191, Monthly Underground Natural Gas Storage Report, to prepare weekly estimates of natural gas in underground storage facilities in each of five regions. Form EIA-191 is completed by all operators of underground natural gas storage fields in the United States. Data are provided for storage volumes in each storage field and reservoir. Each month EIA presents these data in the Natural Gas Monthly aggregated by state and storage region. Approximately 133 underground natural gas storage operators report for their operations at approximately 410 storage fields.
For the sampling and estimation for the WNGSR, the data from the EIA-191 are converted to the sums of field volumes by company and stratum. The six strata are based on geographic region and field type (salt or nonsalt): East, Midwest, Mountain, Pacific, South Central Salt, and South Central Nonsalt. The sampling procedure uses a stratified sample design with probability proportionate to size (PPS) sample selection, with a measure of size equal to the average between the most recently available October and March monthly volumes.
Reported volumes of working gas in storage as reported on the Form EIA-191 are aggregated by storage operator and stratum to prepare the sampling frame for the EIA-912 for each region. For each stratum, the data are divided into two groups. The first—the certainty group—consists of the larger operators in the region as well as all operators with storage fields in more than one stratum. All operators in the certainty group are selected for the sample. The second—the noncertainty group—consists of all other operators, who are selected for the sample with a probability proportional to their size.
EIA selects a stratified sample of companies from the list of operators to achieve a target relative standard error of no more than 5% of the working gas estimate in each stratum. Reports of operators in the certainty group contribute nothing to sampling error. This process ultimately results in about 80 to 85 respondents to the EIA-912 survey that are used for estimation, typically accounting for at least 90% of all storage volumes in a given stratum. Because of the small number of operators with differing behavior in the Pacific region, EIA has opted to survey all eight of them (census) with the implementation of the 2018 sample rather than conduct a sample as is done in the other regions. Before the 2018 sample, EIA selected a sample in the Pacific region and did not survey all eight operators.
Ensuring the quality and accuracy of the weekly estimations depends upon maintenance of the EIA-191 frame. Because the respondents to the EIA-191 are subject to change as a result of births, deaths, and evolving industry structure, the sample is typically reselected every two to three years. During the period between full sample reselections, changes in the sampling frame are made as indicated in the estimation methodology discussed below.
The method of estimation uses both a 12-month moving average of working gas volumes (based on the latest published EIA-191 monthly data, available on a 60 day lag), and the latest EIA-912 weekly data. The trends exhibited by the data from the weekly sample group are used to estimate the latest weekly values for the storage operators not reporting on the EIA-912. Each individual company not selected in the weekly sample is considered based on its own past history in the monthly data from the EIA-191 survey and the weekly behavior of sampled companies within the same stratum. These company-level weekly estimates of working gas stocks for the reporting and nonreporting operators are summed to form the weekly estimated totals for each stratum.
More specifically, for each company in the EIA-191 frame, 12-month equal-weighted moving averages and corresponding standard deviations and coefficients of seasonal variation are computed as described below. For each weekly reporting company i, EIA calculates a company-level ratio, ri,t , of the weekly stock volume reported in the EIA-912 for week t (denoted wi,t ) to the most recently available 12-month moving average of reported monthly stock volumes:
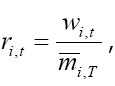
where: | 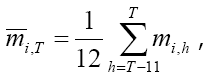 |
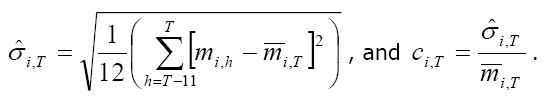
and T represents the reference month for the most recent available monthly stock volume, mi,T , reported by company i . (Usually month T is one or two months prior to the month that includes week t.)
In addition to the mean, the standard deviation across months,![]() , and a coefficient of seasonal variation, ci,T , are calculated for
, and a coefficient of seasonal variation, ci,T , are calculated for ![]() :
:
For each sampling stratum k, let Ck,T denote the median of the ci,T for all weekly-reporting companies i in stratum k. Similarly, let Rk,t represent the median value of ri,t for all weekly-reporting companies i in the stratum.
Let j denote a company in stratum k that is not in the weekly-reporting sample, and let
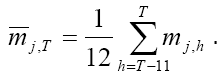
We compute ![]() and cj,T as described above for the weekly-reporting units. The volume of natural gas stored by company j in week t is estimated as
and cj,T as described above for the weekly-reporting units. The volume of natural gas stored by company j in week t is estimated as
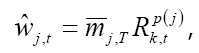
where p(j)=cj,T /Ck,T , a factor representing the seasonal pattern of unit j relative to that of the weekly-reporting units in stratum k.
The company-level estimation equation captures the seasonal variation of a specific company relative to that of the weekly-reporting companies in its stratum. The generality of the estimation equation makes it quite flexible and capable of representing a wide variety of possibilities. For example, if a given company has no variation over the previous 12 months for which estimates are available, so that cj,T = 0 , the estimation equation implies that the latest weekly volume is equal to the 12-month moving average, ![]() . If the company's variation matches the median pattern of its stratum, then cj,T = Ck,T , and the estimation equation implies that the latest weekly volume is equal to the strict moving average estimator,
. If the company's variation matches the median pattern of its stratum, then cj,T = Ck,T , and the estimation equation implies that the latest weekly volume is equal to the strict moving average estimator, ![]() .
.
EIA estimates current working gas inventory for a region as the sum of two total components: the total volume of the reporting companies and the total of the estimated volumes for companies not reporting on the weekly. For each stratum k, the estimated volume of working gas stored in week t is computed as:
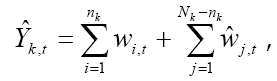
where
Nk is the number of companies in stratum k,
nk is the number of weekly-reporting companies.
Beginning with the implementation of the 2018 sample, EIA will perform independent rounding for all published weekly estimates of working gas stocks. Previously, EIA derived weekly estimates of working gas stocks for the Lower 48 states by summing the corresponding estimates for the five regions. This change is first reflected in revised estimates published on September 10, 2018, when estimates from the 2018 sample were phased in over the eight-week period from July 13, 2018 to August 31, 2018. The first report reflecting this change is for the week ending September 7, 2018, published on September 13, 2018.
An operator’s 12-month moving average and associated coefficient of seasonal variation are updated with the most recent month's data as the data become available. Additional adjustments to the working gas data will be incorporated on an ongoing basis as necessary. Some examples are discussed below:
Reclassification of base and working gas by a sample member: Occasionally, operators of storage fields change the classification of some gas in the storage field from base gas to working gas or from working gas to base gas. (See Glossary for definition of terms.) Because the EIA-912 is a survey of working gas, this reclassification leads to an apparent change in the volume of available gas. A reclassification of significant size is handled by including the reclassified working gas volume in the data used for the calculations of the 12-month moving average and the coefficient of variation. If the reported reclassifications of one or more respondents are 4 billion cubic feet (Bcf) or more, EIA will reflect the amount of natural gas flowing into or out of storage facilities in the estimate of implied flow. Implied flow excludes reportable reclassifications from the weekly net change in working natural gas.
Purchase or sale of a storage field: The adjustments to the estimation system will vary depending on whether the company is in the sample or not.
Startup or shutdown of a field: Field shutdowns are handled by eliminating the company from the estimation process in the case of a single-field company or by removing the associated volume from the 12-month moving average for the appropriate company. In the case of a field startup, the moving average is based on the available information from the EIA-191 survey, so a complete 12-month average is not formed until a year's worth of data are reported on the EIA-191. Field startups exceeding a certain threshold level will become part of the EIA-912 sample before the next sample rotation.
Negative values: Although not a common occurrence, from time to time a company may report a negative working gas value, which may be caused by removal of base gas from storage in anticipation of sale or abandonment of a storage field or withdrawal from base gas at the end of the withdrawal season. When confirmed negative values are received for a field expected to be shut down, a value of zero is entered into the database. If the negative value is the result of temporary withdrawals from base gas, such as occurred toward the end of the winter 2002–2003, EIA announces the occurrence and describes the adopted changes in estimation procedures used to accommodate the withdrawal of base gas at that time. EIA provides further details on the 2002–2003 withdrawal from base gas in the last section of this document.
Nonresponse or data quality issues of individual companies are addressed mainly through implicit or explicit imputation. Imputation of company data values for any stratum typically occurs either by treating the nonrespondent as a company not reporting on the weekly survey or by applying the weekly trend for those reporters in the stratum to the nonrespondent’s data for the prior week.
Computing Estimated Measures of Sampling Variability for Published Estimates of Weekly Working Gas Storage Levels and Weekly Net Changes
This section discusses the methodology EIA uses to compute estimated measures of sampling variability to measure the sampling error for published estimates of weekly working gas storage levels and weekly net changes in working gas storage levels in the WNGSR. Sampling error is the error caused by observing a sample instead of the entire sampling frame. Statistics based on the sample (such as totals, means, and medians) generally differ from statistics on the entire frame because the sample includes only a subset of the frame. For example, if EIA estimates the weekly underground storage level for the East region from a sample of natural gas storage operators, the total stocks estimated from the sample may not be the same as the overall total stocks from the full frame of natural gas storage operators in the East region. EIA has provided answers to frequently asked questions about the incorporation of estimated measures of sampling variability for published estimates of weekly stocks and their net changes in the WNGSR.
Statisticians use measures of sampling variability, such as the standard error (SE) and the coefficient of variation (CV), to measure the sampling error. These measures of sampling variability are typically estimated from the sample that was selected. The standard error, which is measured in the same units (billion cubic feet (Bcf) for the WNGSR) as the estimate, is a measure of the sampling variability of the estimate based on all possible samples that could have been selected using the chosen sample design. The coefficient of variation, which may also be referred to as the relative standard error (RSE), is the standard error expressed as a fraction of the estimate and is displayed as a percentage. Note that for both the standard error and the coefficient of variation, the value for an aggregate level may not be computed by summing the corresponding values for its individual components.
EIA publishes estimated standard errors for estimates of weekly net changes for the Lower 48 states and for each region, as well as estimated coefficients of variation for estimates of weekly working gas storage levels for the Lower 48 states and for each region. EIA publishes these estimated measures of sampling variability in a table in the WNGSR that provides data users with information on a weekly basis regarding the statistical properties of the estimates published in the WNGSR. Also, historical estimated measures of sampling variability are available from the main WNGSR web page, starting with the week ending April 10, 2015. The start of these historical data series corresponds to the published estimates based on the 2015 WNGSR sample, which was designed using the new five-region breakout and was first implemented for the week ending April 10, 2015.
Although a census survey may be subject to other sources of error, such as coverage error, measurement error, or processing error, selecting a full census in the Pacific region means that the census will have no sampling error in working gas estimates in the region. As a result, estimated measures of sampling variability for estimates in the Pacific region will equal zero.
Simple estimators have standard equations for measuring sampling errors. However, because the WNGSR estimator is complex, as described in the preceding section of this report, no standard formula exists to compute measures of sampling error. EIA computes estimates of standard errors for the published estimates of weekly working gas storage levels and the weekly net changes in working gas storage levels using the bootstrap method, in which 1,000 samples (replicates) are drawn with replacement from the operators on the sampling frame that were not selected in the sample with certainty. To incorporate imputation variance, these operators include the ones that were not selected for the WNGSR sample. EIA uses the variability of the estimates of the population values produced from the 1,000 replicates to estimate the standard errors of the WNGSR estimates. Also, EIA includes a finite-population correction (FPC) when estimating the standard errors because the uncorrected bootstrap method acts as though the WNGSR sample was selected with replacement.
Note that the standard error for an estimate of weekly net change is not just the square root of the sum of the squared values of the standard errors for the individual estimates of current and prior weekly working gas levels. This sum is reduced by the covariance between the individual estimates of current and prior weekly working gas levels, which typically lowers the standard error for the estimate of weekly net change when we compute the individual estimates of current and prior weekly working gas levels from the same sample. This mathematical property is also reflected in the bootstrap estimates of the standard errors.
Using Estimated Measures of Sampling Variability to Compute Confidence Intervals
This section discusses how the estimated measures of sampling variability published in the WNGSR can be used with the corresponding published estimates to compute confidence intervals for levels and net changes. For a published estimate of working gas storage level or weekly net change in working gas storage levels, the estimated standard error can be used to compute a confidence interval centered about the corresponding published estimate with a desired level of confidence. EIA selected only one of many possible samples for the WNGSR. If a confidence interval were constructed for each of these possible samples, then the percentage of confidence intervals containing the frame value (if we had surveyed a census of the entire sampling frame under the same conditions as the sample) would be expected to equal the level of confidence. For example, if we could construct a 95% confidence interval for each possible sample that could be selected, then we would expect that 95% of these confidence intervals would contain the value obtained from taking a census of the sampling frame.
To determine the half-width of the confidence interval for a given published estimate, we compute the margin of error (MOE) defined as the estimated standard error of the estimate multiplied by the standard normal percentile for the level of confidence, rounded up to the nearest unit used in publishing the corresponding estimate. The lower bound of the confidence interval is the estimate minus the MOE, and the upper bound of the confidence interval is the estimate plus the MOE. For the standard normal percentile, we use 1.645 for a 90% confidence interval, and we use 1.96 for a 95% confidence interval.
For example, suppose that the published estimate of weekly net change in working gas storage levels for the Lower 48 states is -50 Bcf and its published estimate of the SE is 2.2 Bcf. The MOE for a 90% confidence interval would be 1.645 x 2.2 Bcf, or approximately 4 Bcf, and the 90% confidence interval would be -50 +/- 4 Bcf, or -54 to -46 Bcf.
As another example, suppose that the published estimate of the working gas storage level for the Lower 48 states is 2,000 Bcf and its published estimate of the CV is 0.9%, which implies that its estimated SE is about 2,000 x 0.9% = 18 Bcf. The MOE for a 95% confidence interval would be 1.96 x 18 Bcf, or approximately 36 Bcf, and the 95% confidence interval would be 2,000 +/- 36 Bcf, or 1,964 to 2,036 Bcf.
As a cautionary note, the level of precision used to compute a confidence interval may be more important when using the confidence interval to perform a test of significance. EIA publishes estimates of weekly net changes in working gas storage levels in Bcf as whole numbers. Computing a confidence interval in whole numbers centered about an estimate of weekly net change that is small in magnitude could lead to an incorrect conclusion that the estimate is not significantly different from zero. Rounding can be taken into account by testing the significance of the smallest value in magnitude to the tenth of a Bcf that can be rounded to the published estimate.
Computing the Five-Year Averages, Maxima, Minima, and Year-Ago Values for the Weekly Natural Gas Storage Report
1.) Current Method
Beginning with the Weekly Natural Gas Storage Report for the week ended January 7, 2005, EIA implemented a daily interpolated average approach to calculating the five-year summary statistics and year-ago values reported in the WNGSR. The daily interpolated average approach facilitates simple yearly comparisons of the data, unencumbered by possible confusion associated with ordering weekly data.
The calculations are based on daily linear interpolations of the working gas inventory values between each week reported in the Historical Weekly Storage Estimates Database. Using the historical data, daily data are derived by (1) computing an average daily rate of stock change for each week based on the published weekly data; (2) using this daily rate and the published weekly stock levels to estimate daily stock levels for each day in between the report days. The interpolated daily values are derived as follows:
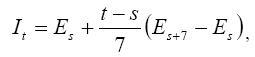
where
It = EIA-estimated interpolated daily inventory level for day t,
Es = EIA-estimated weekly inventory level for day s,
t = {0,1,2,..., T},
s![]() t = {0,7,14,..., T} corresponds to the weekly report day, i.e., Friday, and
t = {0,7,14,..., T} corresponds to the weekly report day, i.e., Friday, and
0 ≤ t - s ≤ 6 is the number days between t and the most recent report day s.
With the resulting daily working gas time series, five-year averages are computed for each day of the year, using the preceding five years of daily estimates. For example, the five-year average used as reference for 01-07-2005 includes the data for 01-07-2000, 01-07-2001, 01-07-2002, 01-07-2003, and 01-07-2004.
The minimum and maximum values for the Lower 48 states that are shown in the storage graph included in the WNGSR are based on a similar treatment of the weekly data. However, regional working gas maxima or minima are calculated independently and so do not necessarily sum to the maxima or minima determined for the Lower 48 states.
The year-ago values in the weekly report are those estimates for the same day of the prior year as the current release. As such, they do not match published data for the prior year. For example, the year-ago values associated with the January 7, 2005, data release are the estimates calculated for January 7, 2004, not those for the report weeks in 2004, which would be for either January 2, 2004, or January 9, 2004.
The five-year (2000–2004) averages, maxima, minima, and year-ago values for each report week in 2005 are available for download at: https://ir.eia.gov/ngs/ngsstats.xls
2.) Method Used for Estimates from May 2002 Through December 2004
The five-year average volume was computed as a simple arithmetic mean of recorded volumes in corresponding weeks during the five-year period. Typically each Friday in a given year was assigned a number from 1 to 52. The first Friday of January was considered the first week of the year, so it was assigned the number 1. The following Friday was identified as week 2, and the procedure continued for all remaining weeks in the year. This procedure orders the weeks, allowing calculation of the five-year average results presented in the Weekly Natural Gas Storage Report (WNGSR). The historical data for the weeks from January 1994 to the present are updated each week and are located on the EIA website at: https://ir.eia.gov/ngs/ngshistory.xls. A link located on the WNGSR directs users to this site.
As an example, the following table contains the data for the first Friday of each year from 1999 to 2003. These weekly values were the basis for the calculated five-year (1999–2003) averages, which were used as the reference values in the first week of 2004.
| Table 1. Sample Calculation for 1st Week of 2004, Using First Weeks in 1999-2003 | |||||
|---|---|---|---|---|---|
| Date | East | West | Producing | Total | Week # |
| 1/1/1999 | 1,615 | 330 | 762 | 2,707 | 1 |
| 1/7/2000 | 1,435 | 297 | 686 | 2,418 | 1 |
| 1/5/2001 | 1,035 | 224 | 352 | 1,611 | 1 |
| 1/4/2002 | 1,600 | 354 | 835 | 2,790 | 1 |
| 1/3/2003 | 1,333 | 342 | 656 | 2,331 | 1 |
| five-year average | 1,404 | 309 | 658 | 2,371 | |
Given that a year consists of 52 weeks plus one or two days, some years contain 53 Fridays. This circumstance occurs only once every few years, so generally there were few data observations in a given five-year period to calculate an average for the 53rd week. For example, 1999 and 2004 both contained 53 Fridays. The values of the five-year averages used in releases of the WNGSR during 2004 were based on data for 1999–2003. For the release of storage data for December 31, 2004, which was the 53rd and final week, the use of average data for only the 53rd weeks in the period would be limited to only the 1999 observation.
As an approach to establish the average value when a 53rd Friday occurs, which occurs on either December 30 or 31, the five-year statistics were based on estimated values for corresponding dates during the five-year reference period. The calculations were based on a linear interpolation of the working gas inventory values between the last week of each year and the following week. The interpolated daily values were derived using the equation in the preceding section.
As an example, the following table contains the interpolated estimates for December 31 of each year from 1999 to 2003. These weekly values were the basis for the calculated five-year (1999–2003) averages, which were used as the reference values for December 31, 2004.
| Table 2. Sample Calculation for 53rd Week of 2004, Using Final Weeks in 1999-2003 | ||||
|---|---|---|---|---|
| Date | East | West | Producing | Total |
| 12/31/1999 | 1,482 | 321 | 720 | 2,523 |
| 12/31/2000 | 1,104 | 230 | 387 | 1,721 |
| 12/31/2001 | 1,674 | 359 | 869 | 2,904 |
| 12/31/2002 | 1,362 | 347 | 659 | 2,368 |
| 12/31/2003 | 1,505 | 324 | 753 | 2,582 |
| five-year average | 1,425 | 316 | 678 | 2,419 |
The minimum and maximum values used in the storage graph included in the WNGSR were based on the same treatment of the weekly data.
Derivation of the Weekly Historical Estimates Database (1993-2002)
EIA began collecting and estimating weekly volumes of working gas in U.S. underground natural gas storage facilities in the spring of 2002. The first survey responses to the EIA-912, Weekly Underground Natural Gas Storage Report, were due Monday, March 18, 2002 with data for the week ending Friday, March 15, 2002. The initiation of this new series of survey estimates raised interest in a comparable set of weekly estimates for prior periods to provide a historical context for the new values. The method for developing the weekly data varied over the historical period.
- Data for December 31, 1993, are based on published data from the EIA monthly survey, EIA-191, Monthly Underground Gas Storage Report.
- The data for the weeks from January 7, 1994, through February 22, 2002, are estimates derived from a computation process that used both EIA monthly survey data and AGA weekly survey data. (The derivation of these data is described in the remainder of this section.)
- Data for March 1, 2002, are the end-of-February published EIA-191 data plus one-seventh of the net inventory changes reported by AGA for the week ending March 1, 2002.
- The data cell values for March 8, 2002, are the midpoint values for March 1 and March 15, 2007.
- The data for the weeks beginning with March 15, 2002, to the present are the product of the EIA weekly survey, EIA-912, Weekly Underground Natural Gas Storage Report.
Derivation of data from January 7, 1994, through February 22, 2002. EIA generated a set of weekly estimates for the period from 1994 to March 2002 based on the EIA monthly data series and the weekly AGA series. The derived series of weekly estimates consists of the AGA weekly series calibrated to the EIA monthly series and is expected to provide a consistent basis for comparison with the EIA weekly series based on the EIA-912 survey.
The estimation method adjusts the AGA weekly values by linearly interpolated values reflecting the ratios of monthly EIA storage volumes and monthly AGA volumes. The steps used to implement the methodology were as follows.
1) Estimates for end-of-month inventory levels based on the AGA series first were calculated for most months covered by the AGA data series because the ends of those months did not coincide with the end of an AGA storage week (Friday). End-of-month estimates for the AGA series were computed by linear interpolation of the corresponding weekly AGA estimates based on the number of days of the storage week contained in the adjacent months.
2) The ratio of EIA end-of-month working gas in storage to AGA estimated end-of-month working gas in storage was calculated for each month. Weekly equivalents of these values were calculated by linear interpolation as described in steps 3 and 4.
3) A step value was calculated for each month by subtracting the end-of-month ratio for the prior month from the ratio for the month of interest and dividing the result by the number of days in the month of interest.
4)A weekly adjustment factor for each Friday (i.e., each storage week) in the month of interest was derived by multiplying the step value for that month by the number of days elapsed in the month (in practice, the number of elapsed days is equal to the date of the Friday marking the end of the storage week) and adding that value to the EIA/AGA ratio for the prior month. For example, if the first Friday of the month occurred on the third day of the month, the weekly adjustment factor for the storage week ending on that Friday would be computed by multiplying the month's step value by 3 and adding that increment to the EIA/AGA ratio for the prior month.
5) Finally, EIA weekly volume estimates were derived by multiplying AGA weekly volumes by the weekly adjustment factors, thus yielding a weekly series calibrated to the EIA monthly data and reflecting weekly variation similar to that exhibited by the AGA weekly series.
The full implementation of steps 1–5 can be represented in equation form. Specifically, the stock level in any given week in a region was derived as follows:
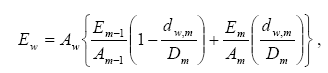
where:
Ew = EIA-estimated weekly inventory level for Friday of week w in month m,
Em inventory level for the end of month m, estimated using data from the EIA-191,
Aw = weekly inventory level for Friday of week w, as estimated by the AGA,
Am = inventory level for the end of month m, estimated by linear interpolation from weekly AGA estimates,
Dm = number of days in month m, and
dw,m = number of days between the beginning of month m and Friday of week w in month m.
In creating this derived weekly series, EIA's primary focus was to produce a weekly series that was fully consistent with the EIA monthly data. (As can be seen from the methodology formula, when the end of a month occurs on a Friday, so that it coincides with the end of a reporting week (i.e., D(m)=d(m)), the equation reduces to the multiplication of AGA end-of-month volumes by the EIA/AGA end-of-month ratio, which yields the EIA end-of-month volumes.) The adopted approach produces a series of weekly estimates calibrated to the EIA monthly data and that reflects the variation in AGA weekly volumes.
Another objective was for the methodology to be relatively simple, straightforward, and easy to understand. The reliance on linear relationships is a practical and useful approach, although it must be understood to be an approximation of the underlying data.
Derivation of the Weekly Historical Estimates Database (2010-2015)
Before 2015, EIA collected working gas inventory levels for three geographical regions. In 2015, EIA began collecting data for five geographical regions. For the period of January 1, 2010 through June 12, 2015, EIA developed new historical weekly WNGSR data that reflect weekly estimates for the five regions. The new history was derived by assigning the previously submitted operator data to the new regions for the samples selected for all periods back to 2010 and assigning the related non-sample estimates to the new regions for the same period. In some cases, the weekly totals are different from previous totals by 1–2 Bcf because of rounding. The current Weekly Historical Estimates Database with five regions includes the derived weekly estimates and can be found at: https://ir.eia.gov/ngs/ngshistory.xls. The Weekly Historical Estimates Database based on the three regions can be found at: https://ir.eia.gov/ngs/archngshistory.xls
Summary of Base Gas Withdrawal Activity During the 2002-2003 Heating Season
(This summary originally appeared in the Weekly Natural Gas Storage Report released on August 8, 2003. It is reproduced here as a reference document.)
Withdrawals from base gas volumes occurred toward the end of the 2002–2003 heating season. EIA first reported withdrawals from base gas in the Weekly Natural Gas Storage Report (WNGSR) for the week ended March 7, 2003. This section of the methodology documentation provides an overview with summary statistics regarding the magnitude of base gas withdrawals.
The cumulative net withdrawals of base gas were treated as negative working gas stocks and were reflected in the working gas inventories reported in the WNGSR. This approach allowed the timely release of information about the total net gas supply from storage for the week while addressing potential risks regarding release of confidential information given the small number of individual respondents.
The resulting respondent data (working gas net of cumulative base gas withdrawals) were used according to the estimation methodology for the WNGSR. Estimated cumulative net withdrawals from base gas grew from the first week reported (March 7, 2003), and they peaked at approximately 19 billion cubic feet (Bcf) for the week ending April 11 (Table 3). As of May 9, the difference between working gas with the base gas adjustment and working gas without the base gas adjustment was less than 7 Bcf. Because only changes greater than 7 Bcf are required under the EIA revision policy, EIA has determined that the explicit release of region-specific base gas data should be limited to the nine weeks (the weeks included in the table) when the national difference met the revision threshold.
For purposes of making comparisons of weekly data from winter 2002–2003, weekly data from previous winters, and its monthly data series, EIA is providing revised estimates of weekly working gas in storage without base gas withdrawal adjustments for the period from March to May (Table 4). The estimates excluding any base gas adjustments will be incorporated in the WNGSR historical database to ensure its consistency with other EIA publications, definitions, and data series. These estimates will be provided as part of the standard downloadable data file in Excel format available in the historical data section. The replacements will be used to compute historical averages and the maxima and minima of working gas in storage.
The weekly stock estimates previously published for this period, which reflected the full quantity of natural gas withdrawn weekly from storage (base and working gas), are provided below for reference (Table 5). The footnote about the withdrawals from base gas is discontinued with the release of the WNGSR on August 14, 2003, containing estimates for August 8.
| Table 3. Cumulative Base Gas Withdrawals (Bcf) | |||||
|---|---|---|---|---|---|
| Week ending | Consuming Region East | Consuming Region West | Producing Region | Total Lower 48 | Incremental Net Change in Base Gas Withdrawals |
| 07-Mar-03 | 12 | 0 | 3 | 15 | N/A |
| 14-Mar-03 | 13 | 0 | 5 | 18 | 3 |
| 21-Mar-03 | 12 | 0 | 5 | 17 | -1 |
| 28-Mar-03 | 12 | 0 | 4 | 16 | -1 |
| 04-Apr-03 | 13 | 0 | 4 | 17 | 1 |
| 11-Apr-03 | 13 | 0 | 6 | 19 | 2 |
| 18-Apr-03 | 15 | 0 | 3 | 18 | -1 |
| 25-Apr-03 | 11 | 0 | 2 | 13 | -5 |
| 02-May-03 | 7 | 0 | 1 | 8 | -5 |
| Table 4. Revised Weekly Natural Gas Stock Estimates, Without Adjustment for Base Gas Withdrawals (Bcf) | ||||
|---|---|---|---|---|
| Week ending | Consuming Region East | Consuming Region West | Producing Region | Total Lower 48 |
| 07-Mar-03 | 343 | 179 | 214 | 736 |
| 14-Mar-03 | 280 | 172 | 202 | 654 |
| 21-Mar-03 | 289 | 167 | 204 | 660 |
| 28-Mar-03 | 317 | 167 | 212 | 696 |
| 04-Apr-03 | 311 | 167 | 210 | 688 |
| 11-Apr-03 | 277 | 167 | 198 | 642 |
| 18-Apr-03 | 313 | 174 | 215 | 702 |
| 25-Apr-03 | 344 | 180 | 230 | 754 |
| 02-May-03 | 392 | 192 | 252 | 836 |
| Note: these estimates are based on the methodology and data available as of August 8, 2003. | ||||
| Table 5. Original Weekly Natural Gas Stock Estimates, With Adjustment for Base Gas Withdrawals (Bcf) | ||||
|---|---|---|---|---|
| Week ending | Consuming Region East | Consuming Region West | Producing Region | Total Lower 48 |
| 07-Mar-03 | 331 | 179 | 211 | 721 |
| 14-Mar-03 | 267 | 172 | 197 | 636 |
| 21-Mar-03 | 277 | 167 | 199 | 643 |
| 28-Mar-03 | 305 | 167 | 208 | 680 |
| 04-Apr-03 | 298 | 167 | 206 | 671 |
| 11-Apr-03 | 264 | 167 | 192 | 623 |
| 18-Apr-03 | 298 | 174 | 212 | 684 |
| 25-Apr-03 | 333 | 180 | 228 | 741 |
| 02-May-03 | 385 | 192 | 251 | 828 |
| Note: these estimates are based on the methodology and data available as of August 8, 2003. | ||||