Weekly Natural Gas Storage Report
for week ending December 27, 2019 | Released: January 3, 2020 at 10:30 a.m. | Next Release: January 9, 2020
| Working gas in underground storage, Lower 48 states Summary text CSV JSN | |||||||||||||||||||||||||
|---|---|---|---|---|---|---|---|---|---|---|---|---|---|---|---|---|---|---|---|---|---|---|---|---|---|
| Historical Comparisons | |||||||||||||||||||||||||
| Stocks billion cubic feet (Bcf) |
Year ago (12/27/18) |
5-year average (2014-18) |
|||||||||||||||||||||||
| Region | 12/27/19 | 12/20/19 | net change | implied flow | Bcf | % change | Bcf | % change | |||||||||||||||||
| East | 771 | 796 | -25 | -25 | 663 | 16.3 | 758 | 1.7 | |||||||||||||||||
| Midwest | 905 | 923 | -18 | -18 | 801 | 13.0 | 904 | 0.1 | |||||||||||||||||
| Mountain | 173 | 177 | -4 | -4 | 147 | 17.7 | 180 | -3.9 | |||||||||||||||||
| Pacific | 251 | 260 | -9 | -9 | 220 | 14.1 | 287 | -12.5 | |||||||||||||||||
| South Central | 1,093 | 1,094 | -1 | -1 | 875 | 24.9 | 1,101 | -0.7 | |||||||||||||||||
| Salt | 313 | 309 | 4 | 4 | 293 | 6.8 | 329 | -4.9 | |||||||||||||||||
| Nonsalt | 780 | 786 | -6 | -6 | 582 | 34.0 | 773 | 0.9 | |||||||||||||||||
| Total | 3,192 | 3,250 | -58 | -58 | 2,708 | 17.9 | 3,230 | -1.2 | |||||||||||||||||
Totals may not equal sum of components because of independent rounding. |
|||||||||||||||||||||||||
Summary
Working gas in storage was 3,192 Bcf as of Friday, December 27, 2019, according to EIA estimates.
This represents a net decrease of 58 Bcf from the previous week. Stocks were 484 Bcf higher than last year at this time and 38 Bcf below the five-year average of 3,230 Bcf.
At 3,192 Bcf, total working gas is within the five-year historical range.
For information on sampling error in this report, see Estimated Measures of Sampling Variability table below.
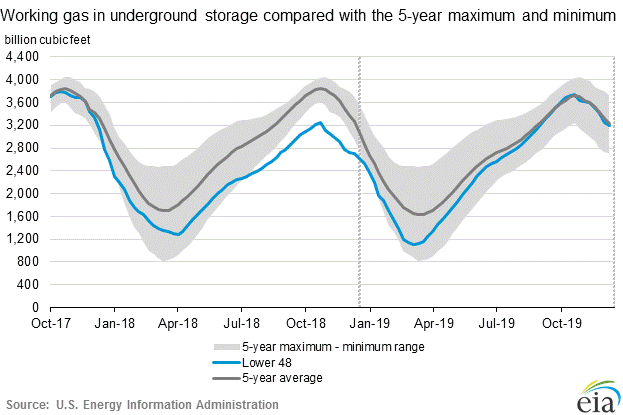
Note: The shaded area indicates the range between the historical minimum and maximum values for the weekly series from 2014 through 2018. The dashed vertical lines indicate current and year-ago weekly periods.
| Estimated measures of sampling variabilityDownload History (April 2015 to Present) | |||||||||||
|---|---|---|---|---|---|---|---|---|---|---|---|
| Coefficient of Variation for Stocks % of working gas |
Standard Error for Net Change billion cubic feet (Bcf) |
||||||||||
| Region | 12/27/19 | 12/20/19 | net change | ||||||||
| East | 1.1 | 1.1 | 0.8 | ||||||||
| Midwest | 0.8 | 0.8 | 0.6 | ||||||||
| Mountain | 0.9 | 0.9 | 0.2 | ||||||||
| Pacific | 0.0 | 0.0 | 0.0 | ||||||||
| South Central | 0.7 | 0.7 | 0.4 | ||||||||
| Salt | 1.6 | 1.7 | 0.1 | ||||||||
| Nonsalt | 0.7 | 0.7 | 0.4 | ||||||||
| Total | 0.4 | 0.4 | 1.1 | ||||||||